Single crystal
structure determination and refinement with X-ray data in GSAS-II
Introduction
In this exercise we will use a set of X-ray single crystal structure factors to solve the structure of dipyridyl disulfide by charge flipping and then refine the structure by least-squares. The structure will be completed by adding the requisite hydrogen atoms and by using anisotropic thermal parameters for the heavier atoms. The structure was originally solved by Raghavan & Seff, Acta Cryst. B33, 386-391 (1977) in the space group P21/c with one disordered pyridine ring with indications that the true space group was P21. It was subsequently reinvestigated by Young (2014….) who found that the true space group was P21 with 4 molecules in the asymmetric unit. The data used in the latter analysis is what is used here and is provided as a “fcf” file obtained after structure analysis by Shelx-97; the structure factors are scaled to those calculated from the structure. We will solve the P 21/c structure first.
Note that menu entries and user input are shown in bold face below as Help/About GSAS-II, which lists first the name of the menu (here Help) and second the name of the entry in the menu (here About GSAS-II). If you have not done so already, start GSAS-II
Step 1. Input phase
information
1. Use the Data/Add new phase menu item add a new phase into the current GSAS-II project. A popup window will appear asking for a phase name; I entered SS dipyridyl; press OK when done. Select Loaded Data/Phases/SS dipyridyl from the GSAS-II Data tree window. The General tab for Phase Data will appear.

2. Enter the space group P 21/c (don’t forget the space between P & 21/c) & press Enter. A Space Group Information popup window will appear; press OK. The General window will be refreshed showing only the needed lattice parameters for P 21/c.
3. Enter 15.8489, 5.5008, 23.118, and 96.9160 for a, b, c and beta, respectively; the unit cell volume will be recalculated at each entry.
Step 2. Import
structure factors
There are two parts to this step: one is to import the data and the second is to connect the data with the phase within GSAS-II.
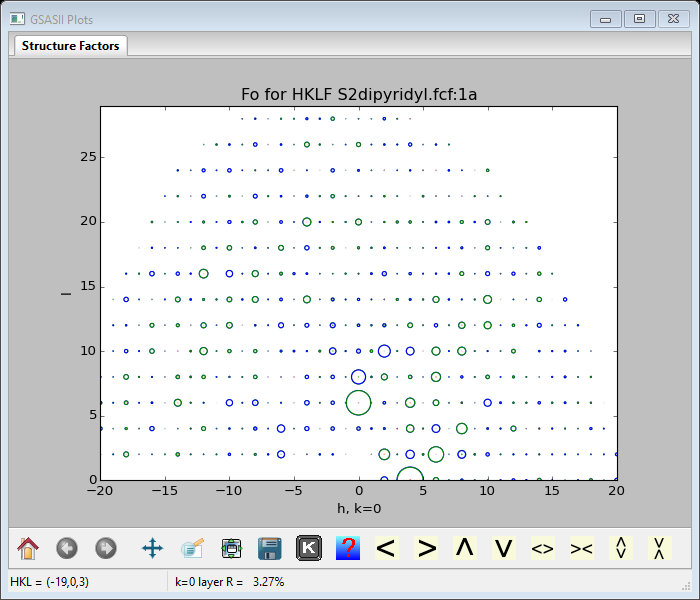
To do these, do Import/Structure factor/from CIF file from the main GSAS-II data tree window menu. A file selection dialog will appear; find CFXraySingleCrystal\data\S2dipyridyl.fcf and press Open. A popup window asking if this is the file you want; press Yes. After a pause while the file is read a new popup will appear offering the chance to rename the structure factor set; press OK. After some time a new popup will appear to Add the new structure factor set to the SS dipyridyl phase. Select the phase and press OK. The plot will show a rectangular array of circles for the hk0 reflection layer; select the plot & press k to get an h0l layer.
Because the fcf file has both observed and calculated structure factors, the plot shows a small R value for the layer. The observed structure factors are shown as blue rings, the calculated ones as green rings and a small green or red dot may appear at each ring center showing Fo-Fc. If the reflection data file had only observed structure factors then only blue rings will be seen. You can explore the plot options in the ‘K’ box in the plot toolbar.
Step 3. Setup for
charge flipping
To solve (again) this crystal structure we will use charge flipping. Charge flipping in GSAS-II is implemented to solve the crystal structure without consideration of space group symmetry. To do this it operates on the entire unit cell volume to a selected resolution (usually 0.5Å) using fast fourier transform techniques. This requires a set of structure factors in an array of the same dimensions as the density array covering the unit cell (i.e. a box bounded by ~0.5Å resolution). The space group symmetry is applied to the observed structure factors to create a full sphere which is then zero filled out to the 0.5Å resolution bounded box. To be reasonably assured of success, the observed structure factors should extend to ~1Å resolution; we have that here for this example. To begin select Phases/SS dipyridyl from the GSAS-II data tree; the General tab will be shown

Find the Fourier map controls and change the Peak cutoff % to 10; then immediately below find the Charge flip controls. Press Select reflection sets, pick HKLF S2dipyridyl.fcf:1a from the list (the only one) and press OK. If you had multiple data sets for this phase, you can pick more than one and GSAS-II will use a “last one in” process for assembling the reflection set to use for charge flipping. There are four more settings to consider: 1) kMax controls the upper cutoff for charge flipping; if the density is > k-Max*sr (map standard deviation) then flip the charge. This prevents the “Uranium solution” sometimes found where all the density is concentrated in a single peak. A useful guide is to use twice the largest atomic number of any element in your structure. For equal atom problems use 12-15; adjust upward for structures with heavy & light atoms. In this case, set k-Max to 30.0 to allow the S atom to appear. 2) k-Factor controls the lower level for charge flipping; if the density is < k-Factor*sr then flip the charge. The default value seems to work pretty well; I’d only change it if the charge flipping is having trouble solving the structure. 3) Resolution selects the spacing between map points. 0.5Å is sufficient in most cases. Choosing a smaller value requires more map points (NB: GSAS-II uses the entire unit cell volume for charge flipping) and thus will require more structure factors since the fast fourier algorithm requires the same size arrays in both real space and reciprocal space. This will slow down the charge flip process. 4) Normalizing element selects a form factor to rescale the structure factors thus “sharpening” the density map. I suggest trying None first, otherwise select a representative element (really doesn’t matter which).
Step
4. Charge flipping
With the controls all set you can now do charge flipping; from the General tab do Compute/Charge flipping. A progress bar popup will appear showing the residual between the observed structure factors and those obtained from the inverse fourier transform of the last flipped density map. It should quickly decrease to the ~20% range and level out indicating a good charge flip solution. When it has reached this, press Cancel to stop the process.
The console window will show something like

There may be a pause at Begin fourier map search before it finishes. Provided is a summary of the charge flip calculation (time, map size, density range & structure factor residual). The map offset is discovered by an analysis of the reflection phases with respect to how they should be distributed for your chosen space group. These offsets are then applied to shift the map so that the symmetry elements are properly located in the unit cell. The quality of this fit (chi**2) is given. This process is not necessarily perfect; you are given an opportunity to hand-tune the offset. Finally the number of peaks found in the map is listed, the structure is drawn (I’ve made the view down the b-axis)

and the Phase data window will show the map peaks tab
These are listed in order of magnitude; a double click on any of the table headings will sort the list according to that parameter. My list has 112 entries; dipyridyl disulfide has 14 C & S atoms so this list is appropriate for 8 molecules in the unit cell and thus all atoms were found in this charge flipping result.
If all went well then the drawing should nicely show all the atoms in the structure placed properly with respect to the locations of the inversion centers (they are at all the corners, edge centers, face centers and cell center). If not then you can shift the map & peaks with the L, R, U & D keys (NB: rotate the drawing so the axes are ~horizontal/vertical); the map/peaks will move in resolution steps (0.5A). The table is also updated with new peak positions. You could also just repeat the charge flipping and hope to get a better map offset solution (examine the map offset chi**2 to get a sense of this). You can also show the map density (highest point is shown as a green dot somewhere in the map – on a S-atom position); select the Draw Options tab and use the Contour level slider. The drawing will show green dots at each set map point with size in proportion to the density. The mouse RB can be used to slide the structure around; the density is always drawn in a space surrounding the view point (multicolored cross at the center). While here you can also change the Bond search factor to 0.90 to ensure all S-C bonds are shown.
If the charge flipping has failed (high residual & no recognizable structure) the process should be just repeated. This gives it a new random start for the structure factor phases which may lead to a good solution. After a few attempts, you can try different control settings to see if that will coax out a good solution; first be sure k-Max is properly set and then perhaps try different k-Factors and do Normalizing by some element form factor. If it seemed to work but very few peaks were found, make sure Peak cutoff was properly set; you can then repeat the peak search by doing Compute/Search map.
Step 5. Extract
solution and make molecules
Assuming that the map & peak positions are properly placed with respect to the symmetry elements of the space group, we can now select those peaks which describe the structure. Select the Map peaks tab and double LB click the blank upper left corner of the table; all entries will be highlighted in blue. Then do Map peaks/Unique peaks; after a bit of time 1/4 of the peaks in the list will be highlighted and the corresponding peaks in the drawing will be green (NB: if you navigate away from this tab, this selection will be lost and you’ll have to repeat it!). The console will show a summary giving the number & fraction of unique peaks found; in this case 28 & 0.25 are the correct values. Next, do Map peaks/Move peaks; these peaks will be transferred to the Atoms list as H-atoms named according to their position in the magnitude column.

The drawing will show white balls at the atom positions scattered over several molecules.
Notice that 4 atoms have magnitudes ~90+, these are the S atoms. The rest are C & N atoms. In the Atoms tab select the first 4 atoms (press LB on the 1st & shift LB on the 4th one). Then do Edit Atoms/On selected atoms…/Modify parameters; a popup window will appear. Select Type & press OK; a Periodic Table will appear. Select S; the atoms will be renamed and their Type changed to S. The structure will be redrawn with yellow balls for the S atoms. Next select the remaining H atoms (a quick way it to double LB click the Type column heading and select H from the popup window). Then do Edit Atoms/On selected atoms…/Modify parameters and Type from the popup; select C from the Periodic Table as we don’t know which ones are N. The drawing will change (you may have to wiggle it a bit to force the update).
Notice that the atoms are scattered over several molecules; we want to assemble them into 2 conveniently placed ones. Begin by selecting an atom (make sure the Atom tab is displayed & do shift LB on an atom in the drawing – I chose the S atom on the left side of the drawing); it will turn green and a line in the Atom table will be highlighted. Next do Edit Atoms/Assemble molecule; a popup window will appear. Change the Bond search factor to 0.90 to be sure all S-C bonds are found.

Press OK; atoms will be collected into a well positioned group, but others are not. Next select one of the unassembled atoms (I chose a C-atom in a nearby SS-dipyridyl) and do Edit Atoms/Assemble molecule; there will be two nicely assembled SS-dipyridyls.
You should probably save this project as it contains your solved crystal structure.
Step 6. Initial
refinement
Since we now have a structural model, we can do the initial structure refinement. By default this will only refine the scale factor; do Calculate/Refine from the main GSAS-II data tree window. Convergence will quickly occur with Rw ~35%. More useful is to refine the atom positions and isotropic thermal parameters. Select the Atoms tab from the Phase window. Then LB double click the refine column heading; a popup window will appear. Select X and U and press OK. The Atoms window will show XU for each atom in the refine column. Then do Calculate/Refine (2-3 times to get convergence) and the Rw ~12%.
Step 7. Determine
C/N choice
We know from the chemistry that the N atom is in the 2 position of the pyridine ring, i.e. next to the point of attachment to the S-atom. However, we don’t know which one that is and we have 8 atoms of which 4 are C and 4 are N.
To work out the C/N problem above we need the atoms to be in a chemically sensible order. The assemble molecule routine did construct chains of atoms but this ordering is not really satisfactory. The ordering can quickly be done by hand by following a labelled drawing. First go to the Draw Atoms tab and double LB click the Style column; select balls & sticks from the popup box. Press OK. Next, double LB click the Label column and select name from the popup box; press OK. Then go to the Draw options tab and adjust the Ball scale & Bond radius to allow the labels to be easily seen. After shifting the view point the drawing should look something like
Now go to the Atoms tab. If you look carefully, you can see that the atoms in each SS-dipyridyl are grouped together in the table but they are not in chemically sensible order. The atoms can be reordered by selecting one row with the Alt key down (the status line will tell which atom is selected to move) and then with the Alt key still down pick a row below where you want to insert it. I ordered them so each S-atom was followed by the C-atoms in order around the ring; my list looked like (I show just the 1st SS dipyridyl molecule)
Once you have reordered the atoms to your satisfaction they can be renamed to be in order. To do this select all the atoms (double LB click the empty corner box) and then do Edit Atoms/On selected atoms…/Modify atom parameters. Select Name and press OK; press Yes to the popup question. The atoms will be renamed in numerical order. Do Edit/Reload draw atoms; the labels will change. In my numbering scheme, half of the C3, C7, C10, C14, C17, C21, C24 and C28 carbon atoms are really nitrogen (if they are ordered). Select these and do Edit Atoms/On selected atoms…/Refine selected; select F, X & U for these. Do Calculate/Refine; the Rw will drop to ~10% and 4 of the atom frac values will be ~1.25 while the others are ~1.0. The former are N-atoms and the latter are C-atoms. Change the Type for the N-atoms and repeat Calculate/Refine; the Rw will be high to start, but immediately fall to ~10%. In the Atom table all 8 refined frac values are be now ~1.0. To finish this part of the refinement, set all frac values to 1.0 and all refine flags to XU. Do Calculate/Refine; the final Rw ~10.5%
Step 8. Anisotropic
thermal motion refinement
Given reasonable measured structure factors one can improve a crystal model by using anisotropic thermal motion models for all the nonhydrogen atoms. To convert all the atoms here select the Atoms tab and then do a double LB click on the I/A column heading. Select Anisotropic from the popup and press OK; the Atom table will be redrawn with Uij values equivalent to the corresponding Uiso (now hidden). Do Calculate/Refine; the final Rw ~8.2%
Step
9. H-atom placement & final refinement
This structure can be completed by adding the 4 H-atoms per pyridine ring (16 in all). One could do this (painfully) by hand by looking for them in DF maps, but it is simpler to just place them knowing the bonding chemistry of the rings. To start this select the Atoms tab for the phase. Then select the C-atoms by a double LB click on the Type column heading and select C from the popup; press OK. The C-atoms will be highlighted. Next do Edit Atoms/On selected atoms…/Calc H atoms; a Distance Angle Controls popup will appear; the numbers should be as before. Press OK; a new popup will appear
This is the hydrogen add control; it shows both the expected number of H-atoms to add to each C-atom and the neighboring atoms used to determine the geometry of the C-H bond. Check to make sure that 4 H-atoms will be added for each ring. Note that C2, C9, C16 & C23 will not have an H-atom added as these are the S-atom attachment points in SS-dipyridyl. Press Ok; the H-atoms will be inserted immediately after the corresponding C-atoms and the drawing is updated showing van der Waals spheres for all atoms.

Next, do Calculate/Refine; there will be an immediate drop in Rw ~3.2%. Note that we did not refine the H-atom positions or thermal parameters. The H-atom insertion process retains the mechanisms for creating them in the first place and these tools can be used to move them to reflect the changes in the C-atom parameters thus forcing them to ride on the C-atoms. Do Edit Atoms/Update H atoms; the H-atom positions & Uisos will be revised. Repeat Calculate/Refine; there will be a slight improvement in Rw. Repeat these two steps (twice); Rw should not change on the last round. This completes the refinement of the SS-dipyridyl structure. You can generate a final DF map from the General tab; in Fourier map controls select the Map type and Reflection sets, then do Compute/Fourier map. The rmax (=0.33) and rmin (=-0.31) are listed on the console; these seem to be concentrated around the S-atoms.